
Demonstration dashboard · programme not yet live
Nothing to hide, everything to count
This is the dashboard every funder, the THA and the public will watch when the first cohort enters the water. Until then it runs on demonstration data — so you can see exactly what we will publish, before you are asked to fund it.
Counted
Witnessed
Published
The demonstration
What a live season will look like
Every figure below is simulated from the proof-of-concept targets. The moment the programme goes live, the same tiles switch to the real feed.
Demo data · illustrative figures
Today, not simulated
0
Juveniles released — when this is not zero, you will see it here first
1
Proof of concept approved by the THA, open to funding
6
Instruments ready to feed this page, from GPS logs to witnessed counts
100%
Of releases to be counted before independent witnesses and published same day
Juveniles released (demo)
861,420
season to date
Egg buckets bought (demo)
372
cash on delivery
Cohort survival (demo)
41.6
%
lab + pens
FADs reporting (demo)
11
/ 12
last 24 hours
Fishing households paid (demo)
23
this month
Next witnessed release (demo)
9
days
public invited
Monthly juvenile releases — a demonstration season
Demo data
Dec
Jan
Feb
Mar
Apr
May
Jun
Demonstration: releases rise steadily each month, December through June.
Why publish before launch
A promise of transparency is easy. A dashboard you can already click is harder to fake.

Sites across Tobago
Where the work will happen
The geography is real: the hatchery site at Black Rock, and the coastal water where the pen moorings, FAD stations and release points are planned. Live status lights come on with the programme.
Hatchery — Black Rock
6 grow-out pens planned
12+ FAD stations planned
4 release points planned
Release points planned: Speyside · Parlatuvier · Buccoo Reef Marine Park · Black Rock. The pens will be towed out to the first three; Black Rock is at the hatchery. Two land-based release points are planned for Phase one.
Money moves against counted, witnessed releases — never against activity reports.
Payment follows results
The commitment
What goes live on day one
This page is a standing commitment. When funding lands and the first cohort enters the lab, these feeds switch on — and none of them can be edited by us after the fact.
Release records, same day
Every witnessed count published the day it happens, with the witnesses named.
Survival at every stage
Hatch, day 20 transfer, day 90 release — recorded as it happens, not reconstructed.
Budgets and spend
Expenditure against budget, visible to the THA, funders and the public in real time.
Open downloads
Release and survey counts as open CSV. Full operational detail for signed-in partners.
Day one
The first real number on this page will be a bucket of eggs, bought at the landing, logged the same hour.

Who sees what
Open by default, detailed by sign-in
Public — this page
No sign-in
Anyone — a fisher, a student, a journalist — sees the numbers that prove the fish are real.
Release counts, witnessed and dated
Cohort survival rates by stage
FAD network status and egg collections
Headline budget and spend totals
Open CSV downloads and the published annual audits
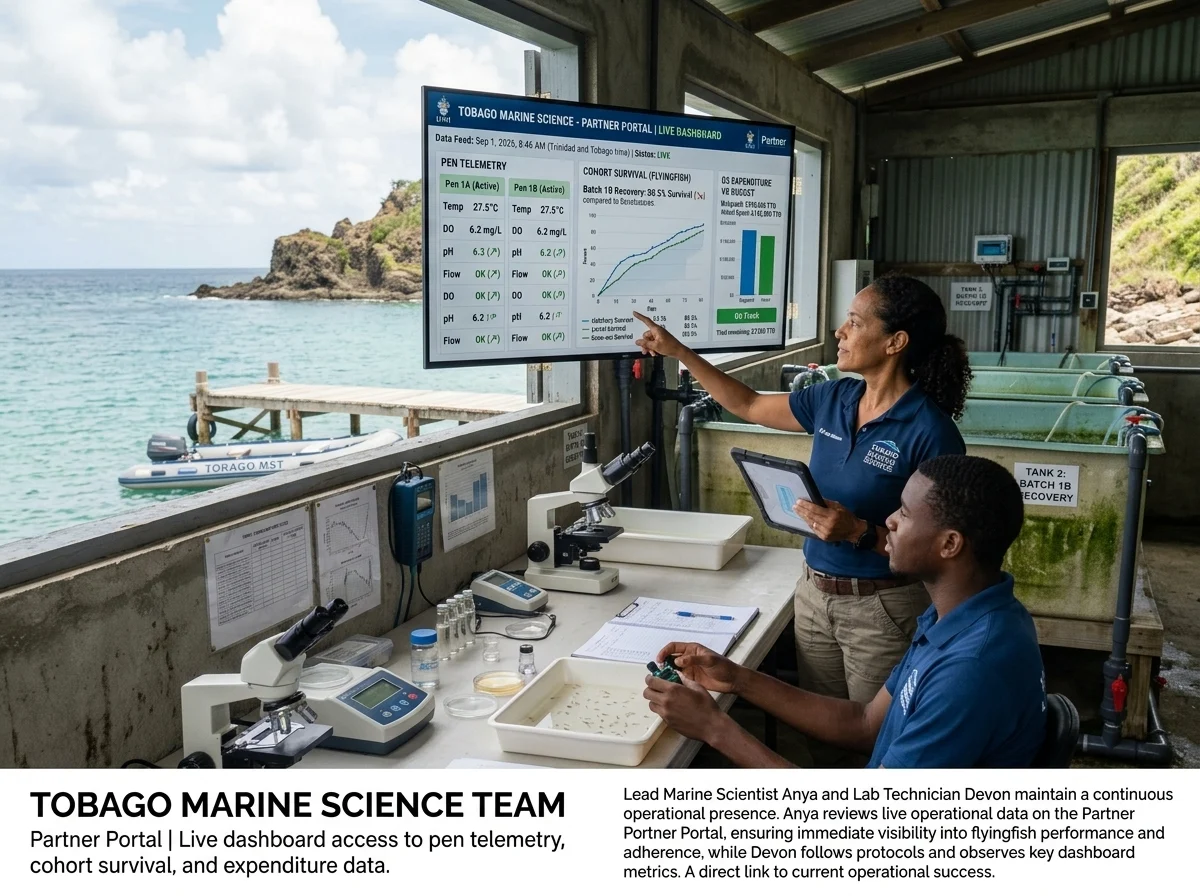
Partner portal
Signed-in
The THA, funders and auditors get the working record — everything the public sees, plus the detail behind it.
Line-by-line expenditure against budget
Named operational logs — collections, transfers, pen checks
Telemetry feeds: water quality, dissolved oxygen, pen sensors
Feeding regimes and growth records, cohort by cohort
Procurement and contracts on the record
Draft audit workings ahead of publication
One rule separates the two: anything that proves the fish and the money are real is public; anything naming individual fishers, suppliers or unpublished audit work stays behind the portal.
The public sees the fish. Partners see the fish, the money and the logs behind them.
Two levels of access
Fund the first real number
The proof of concept is approved by the THA and open to funding. The day it is funded, this page stops being a demonstration.